1. Document control and approval
Version history, author, review, authorization and any change history. When a third party supports the work, internal approval by the responsible organization remains necessary.
A temperature mapping dossier is more than a graph with minimum and maximum values. It should show why the measurement setup was logical, how the study was performed, what the data mean and which storage and monitoring choices follow from it.
A temperature mapping dossier is more than a graph with minimum and maximum values. It should show why the measurement setup was logical, how the study was performed, what the data mean and which storage and monitoring choices follow from it.
Based on the practical structure in WHO TRS 961 Annex 9 Supplement 8 and the ISPE Good Practice Guide for Controlled Temperature Chamber Mapping and Monitoring.
Need to distinguish the plan before measurement from the evidence afterwards? Also read temperature mapping: protocol versus report.
Version history, author, review, authorization and any change history. When a third party supports the work, internal approval by the responsible organization remains necessary.
Description of the room or equipment, storage condition, use, loading, study period and purpose of the mapping, such as qualification, requalification or investigation after a change.
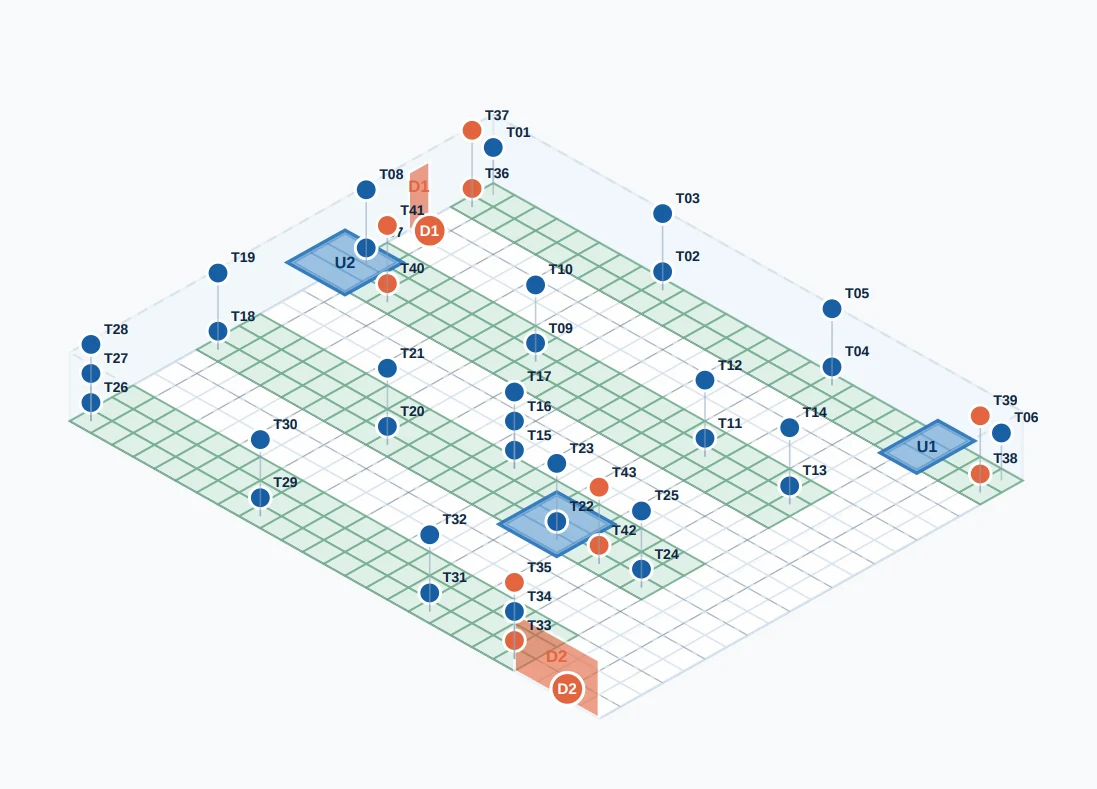
Dimensions, floor plan, racking, doors, HVAC, existing sensors, product zones and expected risks such as air discharge, solar load or height differences. A 3D room overview helps document the relationship between layout, risk zones and logger placement visually.
Predefined temperature limits, for example 2-8 °C or 15-25 °C, including any agreements on door tests, allowed recovery time and deviation assessment.
Logger IDs, positions on drawings, placement rationale, heights, recording interval, start time, study duration and justification of representative and risk-based product locations.
Data loggers used, serial numbers, calibration status, certificates, measuring range, accuracy and traceability to suitable standards.
Start and stop time, loading condition, door movements or access log, disruptions, moved loggers, relevant events and confirmation that loggers were positioned as planned.
Trend graphs, minimum, maximum, mean where useful, hot and cold spots, comparison with acceptance criteria and assessment of patterns by location, height and time.
Temperature excursions, protocol deviations, missing data, possible product impact and any corrective or preventive actions.
Conclusion on suitability of the room or equipment, safe storage zones, zones to exclude, monitoring position and any need for remapping.
Annexes make the dossier traceable and reviewable. Typical items include floor plans with logger positions, raw data, graphs per logger, calibration certificates, photos, access log, deviation reports and signed forms.
Use the structure above as a reference. For your own room, we can prepare a practical proposal for logger rental, dossier preparation or full on-site execution.
Preparing for an audit? Also read what auditors want to see in a temperature mapping.