GDP compliance for API distribution
A temperature mapping study was performed for an API distributor operating under GDP in a storage area for temperature-sensitive API products. The customer carried out the practical placement themselves; we supported the mapping strategy, data interpretation and reporting. Measurement points, duration and acceptance criteria were agreed in advance.
The customer rented the data loggers, received a measurement plan and placed the loggers on site. After the measurement period, the files were reviewed and converted into a report with conclusion, observations and advice for routine monitoring.
This case has been anonymised. The setup and visuals show how the project was carried out in practice, without sharing customer- or product-specific details.
"Being able to place the loggers ourselves and still receive a fully substantiated dossier was exactly what we were looking for. And everything was arranged at short notice."Operations Manager, pharmaceutical distribution (API distribution under GDP)
The project was carried out in three phases
Preparation
Risks, measurement points, duration and acceptance criteria are defined in advance.
Execution
Measurement takes place under normal operating conditions.
Completion
After return, assessment, reporting and practical monitoring advice follow.
The project started with intake, room analysis and definition of the mapping strategy and protocol. The loggers were then sent to the customer, placed by the customer and used during the measurement period under normal operating conditions.
After the loggers were returned, assessment, analysis, reporting and practical advice for routine monitoring followed. This kept the execution simple while keeping the technical rationale well controlled.
Measurement points based on room layout, use and risk
The measurement points were not placed at random. The distribution considered pallet positions, the door and access area, airflow, height differences and representative storage positions. The reference logger was placed centrally to support the assessment of the general room condition.
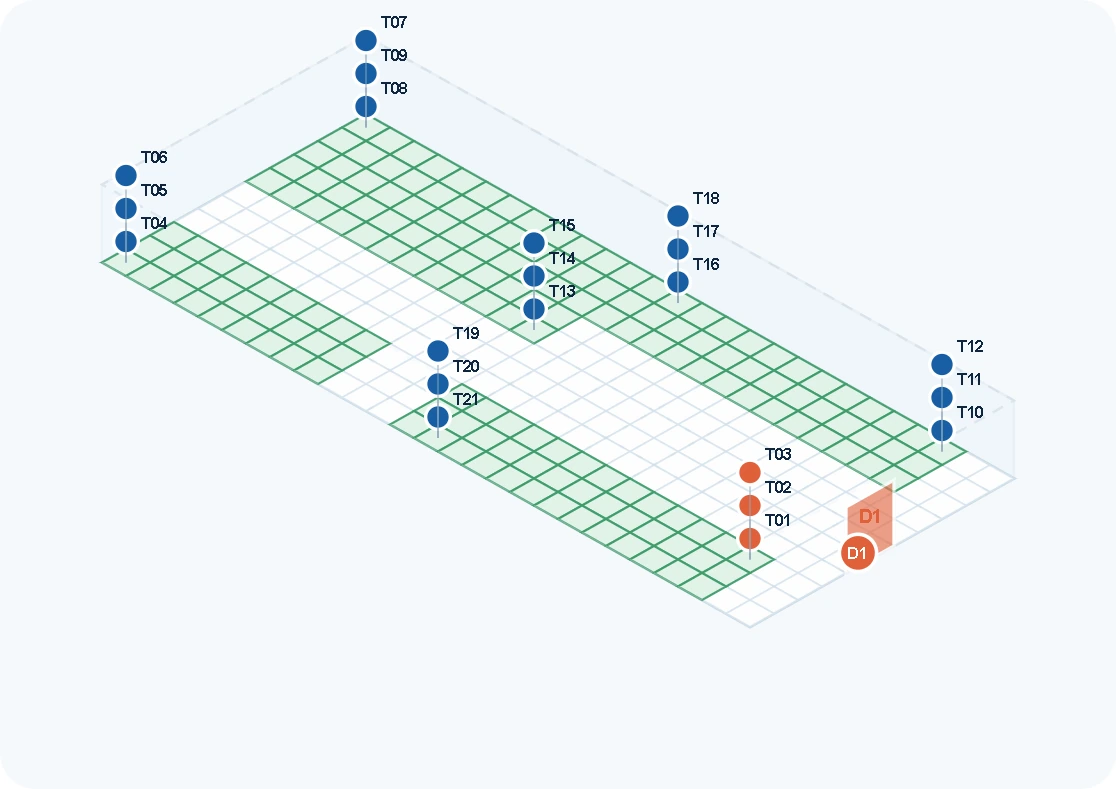
Room overview
The 3D view shows the selected measurement locations by height around the storage zones, door area and reference positions. This makes the distribution of the measurement setup across the room clear at a glance.
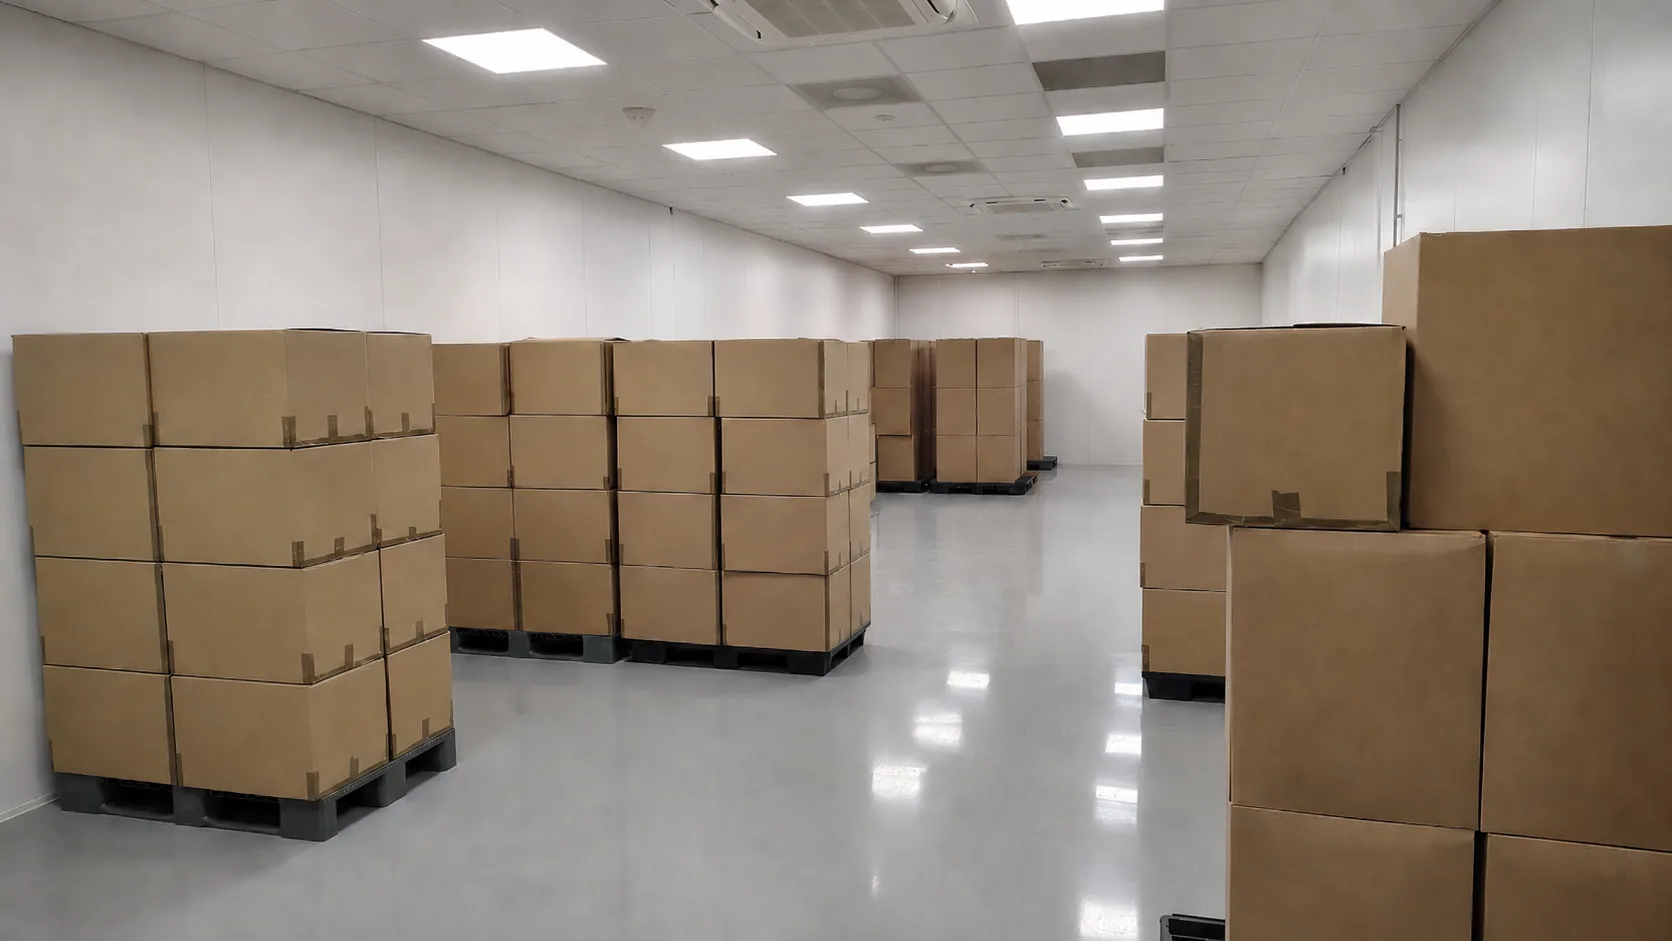
Execution in practice
The measurement setup matched the actual storage layout with pallet positions and walking space. This kept the mapping representative of the normal use of the room.
Why this distribution?
The setup focused on zones where temperature differences are plausible, such as doors, external walls, rack ends and different storage heights. This kept the placement risk-based and easy to explain.
What did it provide?
The customer gained insight into the temperature distribution and could better justify the position for routine monitoring based on measurement data rather than habit or practical preference alone.
Why relevant for GDP?
For API distribution under GDP, temperature control must be demonstrably appropriate for the storage conditions. A traceable mapping strategy helps show that storage, monitoring and assessment are aligned.
From raw logger data to a usable report
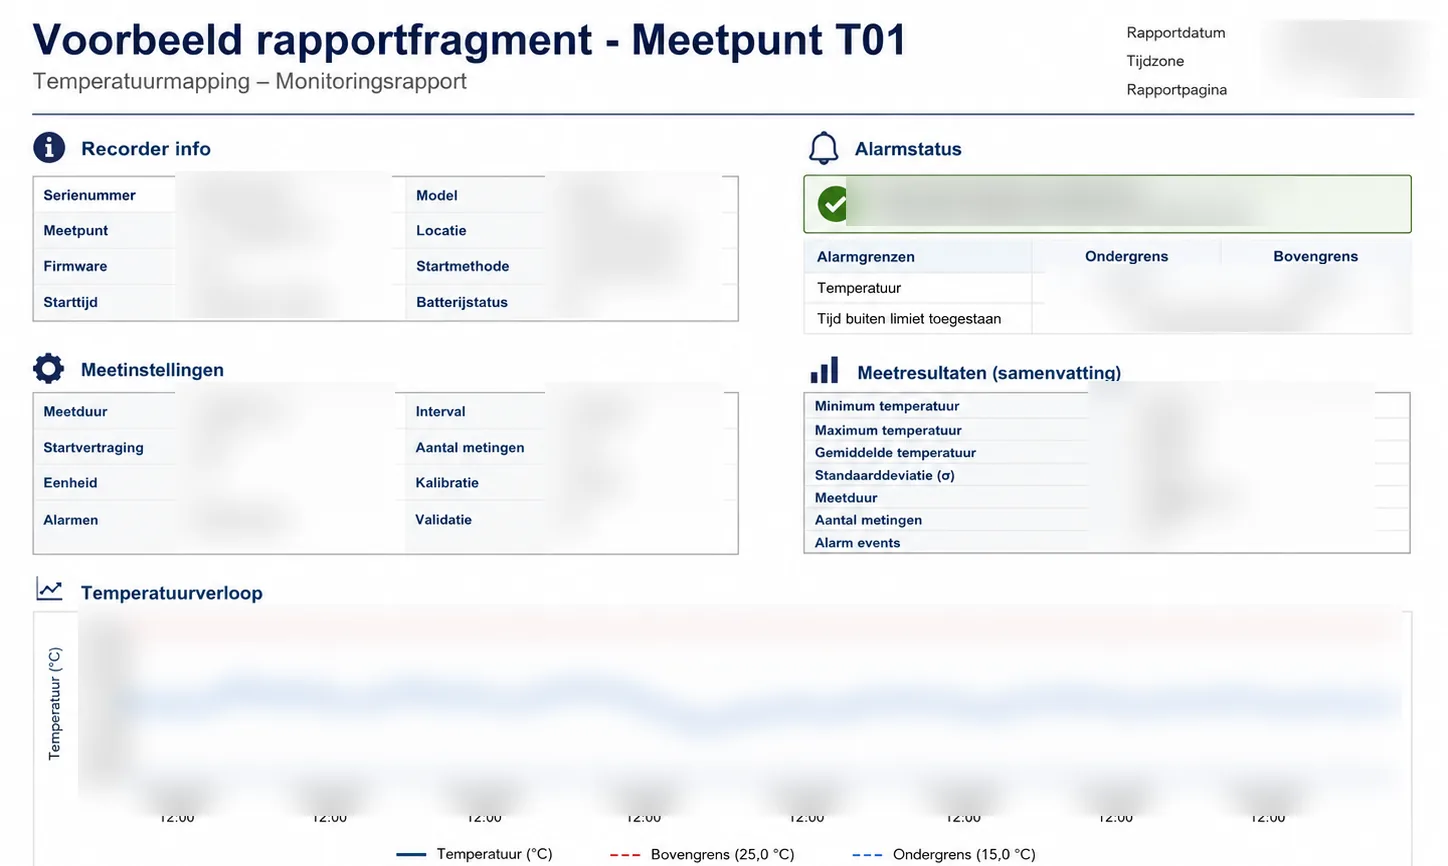
After return of the loggers, the raw files were checked and processed. For each measurement point it was assessed whether the data were complete, whether the logger had recorded correctly and whether the readings stayed within the predefined limits. The temperature trend over the measurement period was also considered, because minimum and maximum values alone do not provide enough context.
Below is an example fragment for one measurement point. In this type of reporting, logger information, measurement settings, alarm status, summary results and the temperature trend are combined with a short conclusion per measurement point. The data in this example are intentionally blurred.
What the customer received
This case shows what a hybrid mapping project can look like in practice: the customer carries out the simple practical steps, while technical quality is supported by a clear strategy, controlled data analysis and a concise report.
Execution without unnecessary complexity
The customer could place the loggers at a suitable moment within their operation. This kept the execution practical and avoided the need for a full external day on site.
A setup that could be explained
The selected measurement points, duration and assessment method were linked to room layout, use and expected risk points. It was therefore clear why these positions were selected.
Report delivered
The final result was more than raw logger exports. The customer received a report with summary, assessment, conclusion and advice for routine monitoring.
Place the loggers yourself, with professional support
Would you like to carry out the practical work yourself, while still making sure the measurement setup, data analysis and reporting are technically sound? The same approach can be applied to your storage room, cold room or distribution environment.