Further reading: hot spots and cold spots
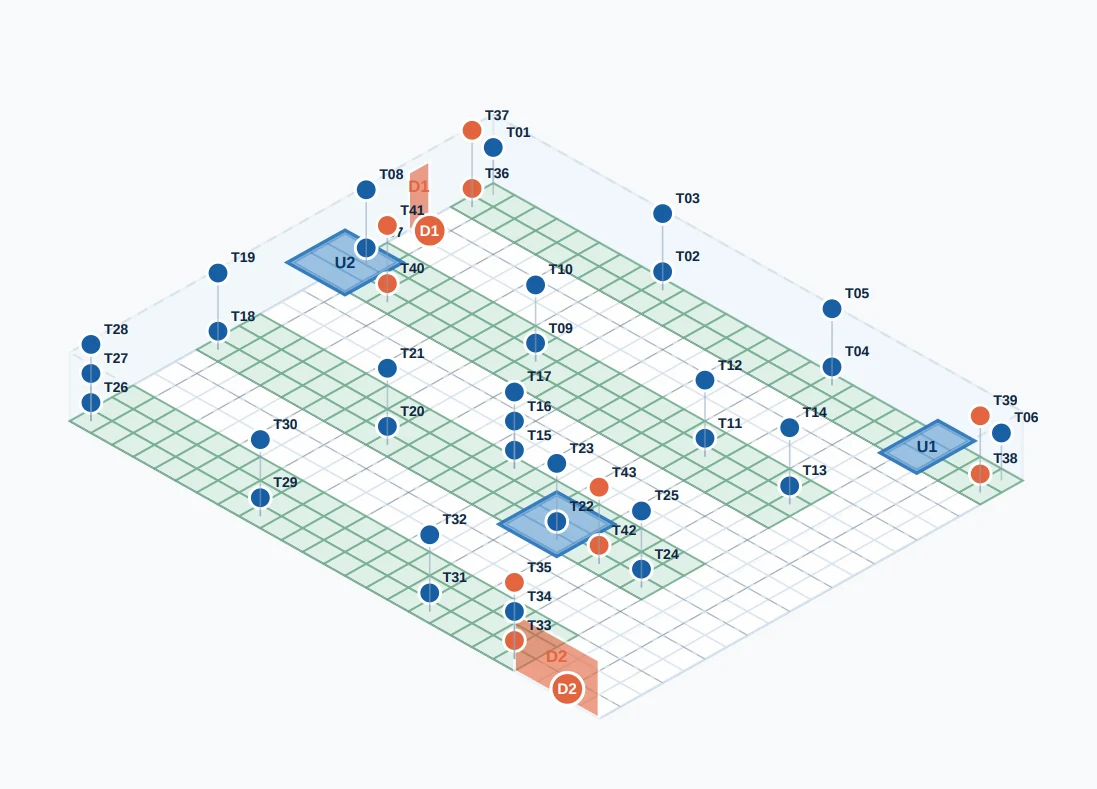
In temperature mapping, the assessment ultimately depends on the warmest and coldest relevant product positions. Learn how these points occur and how they translate into a justified monitoring position.
Read the guide